MATH225N Week 8: Linear Regression Equations
Question
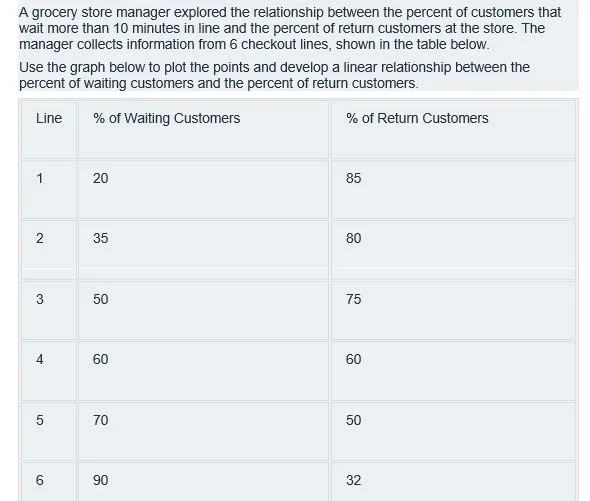
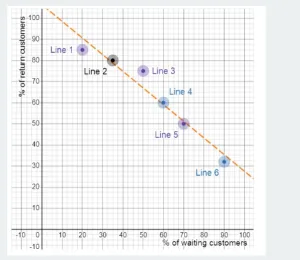
A grocery store manager explored the relationship between the percent of customers that wait more than 10 minutes in line and the percent of return customers at the store. The manager collects information from 6 checkout lines, shown in the table below.
Use the graph below to plot the points and develop a linear relationship between the percent of waiting customers and the percent of return customers.
| Line | % of Waiting Customers | % of Return Customers |
| 1 | 20 | 85 |
| 2 | 35 | 80 |
| 3 | 50 | 75 |
| 4 | 60 | 60 |
| 5 | 70 | 50 |
| 6 | 90 | 32 |
Using the linear relationship graphed above, estimate the percent of return customers if 80% of customers wait more than 10 minutes in line.
Question
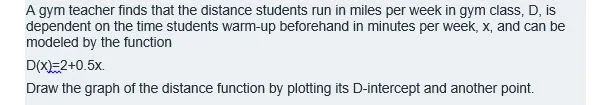
A gym teacher finds that the distance students run in miles per week in gym class, D, is dependent on the time students warm-up beforehand in minutes per week, x, and can be modeled by the function
D(x)=2+0.5x.
Draw the graph of the distance function by plotting its D-intercept and another point.
How long did a student warm-up in order for them to run 10 miles per week in gym class?
Question
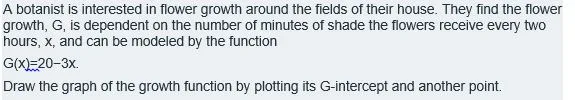
A botanist is interested in flower growth around the fields of their house. They find the flower growth, G, is dependent on the number of minutes of shade the flowers receive every two hours, x, and can be modeled by the function
G(x)=20−3x.
Draw the graph of the growth function by plotting its G-intercept and another point.
Solution
Get questions and answers for $6.00