NR386 Week 2 Practicum Project: Health Promotion Data Collection and Analysis
Part 1: Demographic Data Collection
Directions:
- Access the U.S. Census Bureau Quick Fact. https://www.census.gov/quickfacts/fact/table/US/PST045218
- S. data will automatically populate. Locate the U.S. demographic data to complete all sections of the table below.
- At the top of the U.S. Census Bureau website, enter your zip code or county/township name. The data will populate. Locate the related demographic data to complete all sections of the table below.
- At the topic of the U.S. Census Bureau website, enter your state. The data will populate. Locate the related demographic data to complete all sections of the table below.
Part 1: Data Analysis
Directions:
Analyze the data collected in Part 1 to answer the questions below. Answer all questions with explanations and detail. At a minimum, refer to the Social Determinants of Health (SDoH) for key demographic data to compare such as poverty, race, Veterans, education, etc.
Demographic Data Analysis
- In one or more paragraphs, compare the county, state, and national demographic How are they similar? How are they different?
Part 2: Epidemiological Data Collection
Directions:
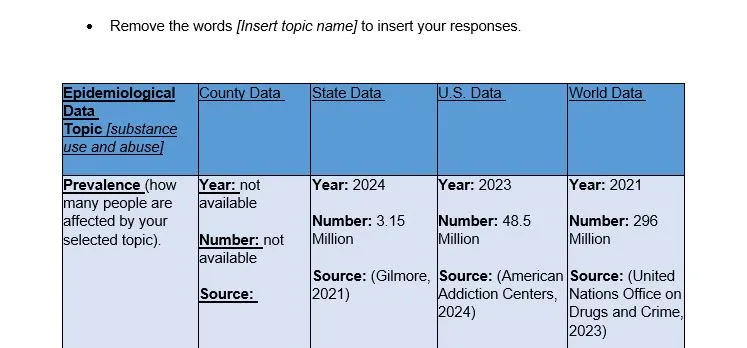
Complete the table below using the epidemiological data collected from the Practicum Project: Sources of Data document link located in the assignment directions in Canvas. Include data from 2 different years for comparison, the number of people affected by your selected topic, and the source(s) of the data. You will need to use several sources of data.
Note: Available data may vary by location and topic. If you are not able to find more than half of the data asked for, please reach out to your faculty mentor before submitting.
Solution
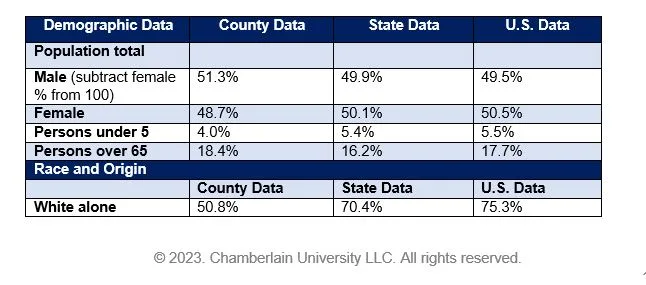
| Demographic Data | County Data | State Data | U.S. Data |
| Population total | |||
| Male (subtract female % from 100) | 51.3% | 49.9% | 49.5% |
| Female | 48.7% | 50.1% | 50.5% |
| Persons under 5 | 4.0% | 5.4% | 5.5% |
| Persons over 65 | 18.4% | 16.2% | 17.7% |
| Race and Origin | |||
| County Data | State Data | U.S. Data | |
| White alone | 50.8% | 70.4% | 75.3% |
Get full solution for $20.00


Reviews
There are no reviews yet.