NR586NP Week 3 Discussion Health Outcomes Data
General Instructions
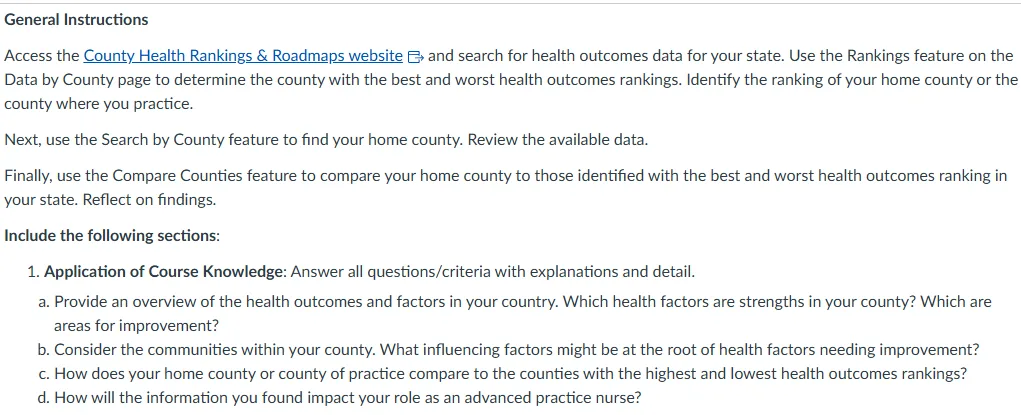
Access the County Health Rankings & Roadmaps websiteLinks to an external site. and search for health outcomes data for your state. Use the Rankings feature on the Data by County page to determine the county with the best and worst health outcomes rankings. Identify the ranking of your home county or the county where you practice.
Next, use the Search by County feature to find your home county. Review the available data.
Finally, use the Compare Counties feature to compare your home county to those identified with the best and worst health outcomes ranking in your state. Reflect on findings.
Include the following sections:
- Application of Course Knowledge: Answer all questions/criteria with explanations and detail.
-
- Provide an overview of the health outcomes and factors in your country. Which health factors are strengths in your county? Which are areas for improvement?
- Consider the communities within your county. What influencing factors might be at the root of health factors needing improvement?
- How does your home county or county of practice compare to the counties with the highest and lowest health outcomes rankings?
- How will the information you found impact your role as an advanced practice nurse?
Solution
The County Health Rankings & Roadmaps source for Illinois includes key health outcomes and key factors working for or against public health. Illinois ranks slightly above the national average in premature deaths rates (7,500 per 100,000 compared to 8,000 per 100,000), the percentages of poor or fair health (14%) are about equal and give similar numbers for low birth weight (8%)……………………Get this solution for ONLY $5.00


Reviews
There are no reviews yet.